Trade #1: Convergence / Divergence & TREND on MACD

Good Morning!!! 26th of December, Merry Christmas!

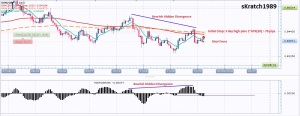
For fun, I´m taking a (Demo) trade based on my Convergence/Divergence Trend Launching System, to see how price will respond.  

Entry Date: 26 Dec. 2013
Pair: EUR/GBP
Entry B or S: Sell @ 0.83535
Initial Stop (Pips): 76.7 pips (3-Day high + 1*ATR(10)) = 0.84302
Exit Strategy: Fractal-Based Trailing Stop

EURGBP

Posted in Trades | Leave a comment

Convergence-Divergence Trend Launching System

Note:  This trading system is my attempt to self-study Convergence / Divergence.  The system calls for looking for Convergence / Divergence MACD entry signals on the daily chart.  A long-term trend filter ensures that entries are only allowed in the direction of the underlying trend.  Once an entry circumstance is identified, we wait until a candle closes over the 9-day EMA to confirm the trend strength.
Category: Divergence into Trend-Following
Type:
100% Systematic (Assuming Convergence/Divergence is systematizable)
Timeframe: Daily

  1. Indicators: 9EMA, 100EMA, 200EMA, MACD
  2. Entry Circumstance: Identify Convergence or Divergence scenario in line with the Long-Term Trend.  Then look for entry based on the Entry Technique.
  3. Entry Technique: To go long, trigger candle closes above 9EMA.  Entry is 5 pips above the trigger candle
  4. Long-Term Trend Filter: 100 & 200 EMA
  5. Initial S/L: 1*ATR below the trigger candle
  6. Take Profit: (1) Opposing Convergence / Divergence, (2) Fractal-Based Trailing stop.

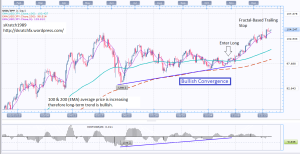
USDJPY Convergence

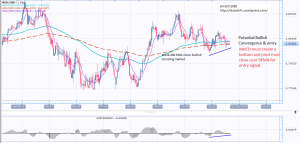
NZDUSD Convergence

What is divergence and convergence? The definition of converge is to come together, for example the lines converge at this point. To diverge means to move or draw apart. When a currency pair is converging, it means that price and momentum are in sync with each other and price is moving at a sustainable pace. When a currency pair is diverging, it means that price and momentum are NOT in sync with each other and action is moving in a less stable/sustainable pace and the likelihood of a correction or even reversal increases. The divergence-convergence analysis basically measures the power a currency has at one point in time with another point in time and then compares the two with each other. The analyst can then judge whether the currency is showing signs of strength or weakness. – Chris Svorcik

External Sources:

  1. How to Predict the Future: The Power of Divergence – Chris Svorcik
  2. Trading with MACD – by Kevin Riordan
Posted in System Design, Trading Systems | Tagged , , , , | Leave a comment

2EX Breakout System

Note:  2EX stand for 2 EMA Cross This system combines the use of two EMAs (5 and 9), with a 100 EMA Long-Term Trend Filter and a MACD entry confirmation. 
Category: Breakout Trend-Following System
Type: 100% Systematic
Timeframe: Daily

  1. Indicators: EMA (5, 9, 55, 100), MACD (12, 26, 9)
  2. Entry Technique: Enter long when the 5 EMA closes above the 9 EMA and vice-versa
  3. Entry Filter: MACD histogram must be positive to go long, or negative to go short.  (This shows strength)
  4. Long-Term Trend Filter: 100 EMA (Price must be above to go long, or below to go short)
  5. Initial S/L: One times the average daily range over 10 days subtracted from the low of the breakout candle (Breakout Candle Low – 1*ATR (10))
  6. Take Profit: ADX-Based Stop : If ADX > 30, we exit if price closes below 55 EMA.  If ADX < 30, we exit when MACD histogram closes below 0.
Posted in System Design, Trading Systems | Tagged , , , , | Leave a comment

Near-Term Support & Resistance

Support and Resistance (S&R) is one of the first things beginners learn when studying technical analysis in Forex.  It seems that every book mentions it, every website has a few articles about it, but how can we implement it in a trading plan?

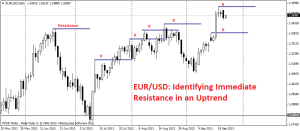
I recently read an article by Chris Scvorcik, and his identification of near-term S&R struck me as genius.  He calculates immediate S&R by looking at the recent daily highs and lows:

In an uptrend a pause of one day (no new daily high) is equal to a minor resistance;
In an uptrend a pause of two days (no new daily high) is equal to a major resistance;
In a downtrend a pause of one day (no new daily low) is equal to a minor support;
In a downtrend a pause of two days (no new daily low) is equal to a major support.
Source: “A Million USD Forex Strategy” by Chris Scvorcik

Step 1: Identify a near-term level of Support or Resistance
Here is an example of a EUR/USD Chart where I’ve identified various near-term levels of S&R.
eurusd-d1-fxdirectdealer-2
Step 2: Determine if you are trading a Trend-Continuation Setup (Trend-Following Traders) or a Trend-Reversal Setup (Counter-Trend Traders)
One of the major rules of determining S&R is that the more times the S&R is touched and respected by price, the more powerful the S&R. 

When determining these levels we are in effect determining a level of S&R that has only been touched once.  Breakouts continuations are therefore likely to be just that – trend continuations.   Chris explains in his article, (and I highly recommend that you read it), how these levels of Support and Resistance may be used either as a Trend-Continuation Setup or combined with other indicators as a Trend-Reversal Setup.

Step 3: Trend Setup – Determine if you are using this signal as a Filter, Entry Trigger or Confirmation
This decision must, in fact, be made with every indicator, tool, oscillator that you use.
1. Entry Filter – If you want to use the S&R level as a filter, consider a rule that would not allow you to respect your entry trigger until a new high has been made.
2. Entry Trigger – These short-term S&R levels have the potential to be great entry triggers into a trend.  Other filters must be used to determine the direction of a trend, then once you determine one of these levels all you have to do is wait for the continuation breakout.  Wait for the daily candle to close to be sure a breakout has occurred.  Place a limit order above (below in a downtrend) the breakout to be filled on a price continuation.
3. Confirmation – An interesting alternative to a filter.  Maybe your entry criteria is triggered, all your filters say go so you take the trade.  However, you can use this as a confirmation, for example if you are unable to pass the S&R in 2 or 3 days you close the position.

Posted in Components of a Trading System, System Design | Tagged , , , | Leave a comment

EMA Ribbon & MACD entry confirmation by CookieMonster

Original Link: Click Here
Note:
This is an interesting system that combines the use of a Three EMA Ribbon (5, 9, and 18 EMA), with a 55 EMA Long-Term Trend Filter and a MACD entry confirmation.
Category: Breakout Trend-Following System
Type: 100% Systematic
Timeframe: 4H or Daily

  1. Indicators: EMA (5, 9, 18, 55), MACD (12, 26, 9)
  2. Entry Technique: Enter long when 5 and 9 EMA cross over the 18 EMA, with the 5-day EMA at 10 pips distance from the 18-day EMA (MA Entry Buffer) and vice-versa
  3. Entry Filter: MACD histogram must be positive to go long, or negative to go short.
  4. Long-Term Trend Filter: 55 EMA (Price must be above to go long, or below to go short)
  5. Initial S/L: 45 pips
  6. Take Profit: >90 pips

My (sKratch1989) comments:

  1. I like this system.  At first glance it looks a little confusing, but if you draw out the indicators on a chart you will see how simple the system really is.  The 55 EMA Filter is designed to keep us out of non-trending markets.  Maybe we will miss some good trades, but it will keep us out of enough bad trades that the filter is profitable.
  2. Specify Entry Criteria: We need to know if you enter at market when the 5 and 9 EMA cross over the 18 or if we have to wait until a close.  I would wait for a close since this is a breakout system.
  3. Alternative Initial Stop: Consider an initial stop of 1*ATR or 0.5*ATR below the low of the candle upon entry.
  4. Alternative Take Profit: ADX-Based Stop : If ADX > 30, we exit if price closes below 55 EMA.  If ADX < 30, we exit when MACD histogram closes below 0.

Other Resources:

  1. Trading Forex Trends with MACD & MA’s – Jay Kaeppel (Investopedia)
Posted in Trading Systems | Tagged , , , | Leave a comment

14 EMA + Parabolic SAR (Breakout Trend-Following System)

Original Link: Click Here

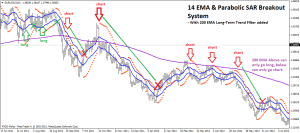
Note: This system was originally designed by its author to be run on the 1h chart (However, I believe it is employable on the 4h or Daily chart as well).  The system uses a 14 EMA channel on the highs and lows to envelope volatility.  When price pushes up and closes above, we go long.  When price falls out of the channel and closes below, we go short.  The only filter used is a Parabolic SAR upon entry for a strength confirmation.
Category: Breakout Trend-Following System
Type: 100% Systematic
Timeframe: Either 1h, 4h, or Daily

  1. Indicators: 14 EMA Channel (14 EMA applied to high & 14 EMA applied to low) & Parabolic SAR (step 0.02, 0.2)
  2. Entry Technique: Buy when price closes above the 14 EMA high, sell when price closes below the 14 EMA low.
  3. Filter: Price must be above Parabolic SAR to go long (and price must be below Parabolic SAR to go short)
  4. Initial S/L: 50-60 pips
  5. Take Profit: 60-100 pips

My (sKratch1989) comments:

  1. This is a wonderfully simple system. This is actually a strength.  Starting with a simple system allows you to add filters without the risk of over-optimization.
  2. I would choose a volatility-based stop. Rather than setting the initial stop at a fixed number of pips, I would elect to use a multiple of the daily range.  If the system is to be operated on the 1h chart, maybe 0.5*ATR(10).  If the system were to be run on the daily chart, perhaps 1.5*ATR(10).
  3. I would eliminate the Take Profit.  This tends to be a controversial topic.  Should I use a take profit or not?  As a general rule, if your system is a trend-following system, then I would not use a specific take profit, but rather chose to exit the position based on certain market movements.  Some choices may be: (1) Fractal-based Trailing Stop, (2) Multiple of ATR Trailing stop, or (3) Close position if a close is below two prior days’ lows and below the current day’s opening.
  4.  I would add a Trend Filter.  The system is simple enough that a filter may be applied.  This would decrease the amount of trades entered, hopefully keeping us out of more losing trades than winning trades.  For example, consider a rule such as: Last close > 200 EMA to go long or < 200 EMA to go short.

14 EMA & Parabolic SAR with Trend Filter

Posted in Trading Systems | Tagged , , , , , | Leave a comment

Simple Moving Average Crossover (With ADX Trend Filter) – System Review

Original Link: Click Here

Note: This is a very simple system that has an ADX trend filter which filters out all trades where ADX is below 30, and keeps all trades that occur when ADX is greater than 30.
Category: Moving Average Trend-Following System
Type: 100% Systematic
Timeframe: Daily

  1. Entry Technique: Buy when 20 SMA > 50 SMA, Sell when 20 SMA < 50 SMA.
  2. Filter: (ADX Trend Filter) Only enter a trade when ADX > 30.  This will confirm that the currency pair is trending either up or down.  A value of less than 30 means that the pair is non-trending.
  3. Initial S/L: none
  4. Trailing S/L: none

My (sKratch1989) comments:

  1. Analyzing this system has presented the ADX Trend Filter with clarity.  This is a great system to analyze as it is extremely simple and you can see how the ADX works as a trend filter.  As the original author noted, the trend filter will effectively keep us out of profitable trades as well as losing trades, it is inevitable.  Overall, however, it should cut more losing trades than winning trades, making it a profitable addition.
  2. Initial S/L or Trailing S/L? This system does not use an initial stoploss or trailing stoploss, mostly because the system itself is a demonstration of the ADX Trend Filter.  HOWEVER, if I were to apply a stoploss, maybe we could consider an initial stoploss of 2*ATR(10) and a Fractal-Based Trailing Stop.

External Sources:

Posted in Trading Systems | Tagged , , | Leave a comment

“Essence of a Trend-Following System”

Every good trend-following method should automatically limit the loss on any position, long or short, without limiting the gain. Whenever a trend, once established, reverses quickly, there is always a point, not far above or below the extreme reached prior to the reversal, at which evidence of a trend in the opposite direction is given. At that point any position held in the direction of the original trend should be reversed – or at least closed out – at a limited loss. Profits are not limited because whenever a trend, once established, continues in a sustained fashion without giving any evidence of trend reversal, the trend-following principle requires that a market position be maintained as long as the trend continues.
                                                                                                                             – Richard Donchian

What is a Trend-Following (TF) system? 

Sometimes we get so distracted by indicators, timeframes, etc. that we forget to step back and remind ourselves what it is exactly that we are trying to do.

Through the development of a TF system, our goal is to identify when the market has “broken out” of a volatility-confined area.  This area may be identified through standard deviation, moving averages, Donchian channels, etc.  When there is enough volatility in the market so that price “breaks above” either the upper or lower band, trend-following channels kick in.  It is estimated that most markets trend 20% of the time, while 80% of the time it remains confined in a sideways movement.  If we are operating a TF system, we want to be in the market during that 20% extreme volatility to catch the big moves.  Otherwise, if we take entry signals with weak volatility we are likely to get whiplashed.

At the center of the band of price movement, we can place a moving average (or Donchian centerline).  At any one time, price is oscillating around this centerline.  When volatility increases, and price breaks out of the band, we enter long with the hope that the volatility will pull the average up above the entry price, and therefore lock in a gain.

When we design a trading system, we need to ask ourselves three questions:

  1. When do I get in?
  2. When do I get out with a loss?
  3. When do I get out with a win?

Let’s try to answer these questions from a Trend-Following perspective.

  1. When do I get in? Get in when there is proof of market strength.  This may be measured through a movement greater than the average daily range, outside of a bandwidth, ADX greater than 30, Divergence, Breakouts, Close must be above the four previous closes, etc.
  2. When do I get out with a loss? (a) If our reason for entry has been negated.  (i.e.  failure to make a new high in 3 days, drop in ADX, movement against position by greater than one average daily range) (b) Adverse movement greater than my risk tolerance.  Hopefully your system is designed so that your risk tolerance is large enough to keep you in a position until your reason for entry has been negated. 
  3. When do I get out with a win? (a) Until the market shows weakness. (i.e. failure to make a new high in 3 days, drop in ADX, movement against position by greater than one average daily range) (b) Change in trend direction. (i.e. Fractal-based Trailing stop, moving average cross) (c) Until the position reaches a certain level of profit (not always a recommended reason for taking profit because since trend-following systems generate a limited number of profitable trades, we want to ride them out until they show weakness)



Posted in Components of a Trading System, Retrospection, System Design, Trading Systems | Tagged , , | Leave a comment

The 2/20-Day EMA Breakout System by David S. Landry – System Review

Note: This is a system that I’ve stumbled across which REALLY intrigues me because of its simplicity and ingenuity.  Not only that, but it has opened my eyes to another type of trade filter, the two-day breakout filter.
Category: Breakout Trend-Following System
Type: 100% Systematic
Timeframe: Daily

  1. Entry Technique: If today’s low and yesterday’s low is greater than the 20-day EMA, go Long.  (and vice-versa if short)
  2. Filter: The two-day breakout filter (two day’s lows > 20 EMA)  is required in order for the breakout to be considered valid.  If price pulls back from the 20-day EMA, before two days have closed above, you won´t enter the trade.  (and vice-versa if short)
  3. Initial S/L: 20-day EMA
  4. Trailing S/L: 20-day EMA

My (sKratch1989) comments:

  1. The filter is genius. Two-day breakout is a sort of confirmation / filter before entry so that you have confirmation before entry.
  2. Widen S/L: I would have to test the system, but I would consider widening the S/L.  If the 20-day EMA is your entry point, if price falls back to the 20-day EMA, it doesn’t mean your trading view is invalid.  Perhaps a better choice would be 20-day EMA – 0.25 ATR or 20-day EMA – 20 pips.  Another option is to design some sort of ADX-based stop-loss and combine it with the 20-day EMA. 
Posted in Trading Systems | Tagged , , | Leave a comment

Fractal-Based Trailing Stop

Note: A fractal-based trailing stop is best employed in a trend-following system. Since fractals are included in the definition of a trend, we can use them to design trading strategies, either as an entry trigger or a trailing stop.  (Here we look at the use of fractals for a trailing stop)
This is a great way to include a trailing stop into your strategy while considering the natural ebb and flow (noise) of the market, and give it room to breathe.   The strategy should identify the direction of the trend, make an entry based on some entry criteria, place an initial stoploss,   and then we can use this trailing stop to let our winner run!  The goal is to get into a risk free trade and lock in as much profit as possible while not getting stopped out.
Category: Trend-Following Strategies
Type:  100% Systematic (See Designing A Fractal-Based Trailing Stop EA – Mark Thomas )

Bill Williams defines a fractal as a specific sequence of 5 bars:  

  1. Bearish Fractals: 5 bars (or candles), center bar is the highest with two lower highs on each side.  This indicates a high probability of a bearish movement.   
  2. Bullish Fractals: 5 bars (or candles), center bar being the lowest two higher highs on each side.  This indicates a high probability of a bullish movement.

 Also,

 Fractals may be included in the definition of a trend:

  1. A Bearish Trend is made up of lower highs and lower lows, aka lower bearish fractals and lower bullish fractals.
  2. A Bullish Trend is made up of higher highs and higher lows, aka higher bearish fractals and higher bullish fractals.

Variations:

  1. Tight Fractal-Based Trailing Stop – place trailing stop behind the last fractal.
  2. Loose Fractal-Based Trailing Stop – place trailing stop behind the second to last fractal.
Posted in Stoploss Theory | Tagged , | Leave a comment